
Blog 3a: Webscraping the CIA's "World Factbook"
How I gathered information on several countries via web scraping
Where in the World are we Willing to Go?
My husband and I both work with computers- he’s interested in software while I’m interested in data science- but jobs for those are all over the world. Part of the modern information workforce is being willing to go where the jobs are. My husband and I would have to take a lot of factors into consideration if we decided to move outside of the United States for our future jobs. We would need to look into available industry jobs, housing, medical care, taxes, languages…. and that’s just to decide which country to move to, let alone which city! I want to restrict the number of countries I’m willing to research to a manageable amount.
What is The World Factbook?
Above is the front page of The World Factbook, a public-facing resource for country data published by the CIA. The World Factbook is a collection of basic facts, demographics, and statistical estimates for 266 countries. The CIA also publishes several charts comparing different data rankings for countries. There are (as of publishing this blog) 52 different Country Comparisons to choose from. While I could scrape all 266 country pages for information, the Country Comparison pages are laid out into easy-to-read tables with rankings from highest to lowest in a category. The only two exceptions to that rule are the Unemployment rate and Inflation rate comparison pages, which are ranked from lowest to highest. The World Factbook is public domain and can be freely accessed at any time, so I know I am legally and ethically okay to scrape this data.
Determining Which Factors to Consider First
I want to have a beginning idea of which countries have the best medical care, internet access, education, and economy. I pulled from 7 of The World Factbook Country Comparisons to approximate the aforementioned factors:
- Maternal mortality ratio: the annual number of female deaths per 100,000 live births
- Infant mortality rate: the annual number of the deaths of infants under one year old per 1,000 live births
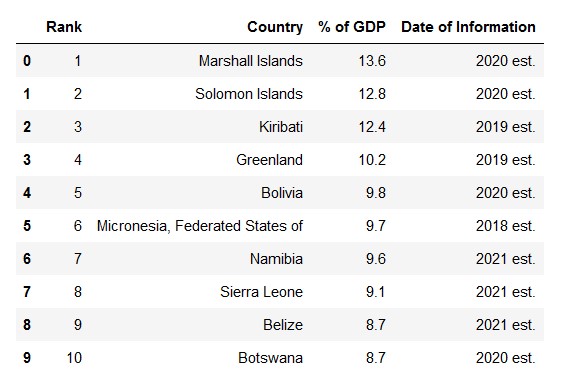
- Education expenditures: the percentage of GDP spent on education
- Unemployment rate: the percent of the labor force that is unemployed. This comaprison is ranked from lowest to highest
- Gini Index coefficient – distribution of family income
- Internet users: the number of users within a country that access the Internet. The CIA notes that counting internet users in a country is not standardized, so could include people who access the internet anywhere from weekly to biannually
- Broadband - fixed subscriptions: the number of subscriptions for physically wired connection to the Internet
Each Country Comparison has 4 columns: the Rank, the Country name, the metric, and the date the CIA last updated that information. The rows were always variable in number, but generally were near 200.
Using BeautifulSoup to Web Scrape
The Python library BeautifulSoup is a tool to pull data from HTML and XML formats. I also used the Requests package to handle get requests to the CIA website and collect the table text from their Country Comparison pages. Once I familiarized myself with the HTML code of The World Factbook, it was time to start scraping.
Collecting Web Links
I only wanted 7 of the Country Comparison tables, but I didn’t want to copy and paste 7 urls of each table’s page into my code. I instead used BeautifulSoup on the main Country Comparison page to save every web link containing /country-comparison in the url to a list that I could filter through later. I also grabbed the names of the urls I wanted to scrape, e.g. 'unemployment-rate', and saved that to another list to create a nested for loop later.
Filtering Web Links
I dropped all but 9 links after filtering. It turns out there are 2 urls that contain 'unemployment-rate': the Unemployment rate and the Youth unemployment rate (ages 15-24). I also grabbed 2 copies of the Youth unemployment rate (ages 15-24) by accident due to the nature of my nested for loop. I had to use enumerate to make sure I dropped the extra link both times to get the 7 I wanted. Note that if you gather website links from a website, you may need to check for duplicates or partial matches!
Collecting the Table Data
With the important links ready, an empty dictionary, and a familiarity with the HTML structure of the Country Comparison pages, I was able to collect the data. One interesting thing about collecting HTML table data from The World Factbook is that the data is formatted as to resist spacing conventions if scraped by row. I instead had to scrape each cells’ contents separately and then use download another library, from itertools import islice, to select every four cells and then zip() them together into a row. Below is a segament of the code I had to use in my for loop data collection:
#grab table cell contents and combine back into rows
    content = [row.text for row in table.find_all("td")]
    sliced_content = []
    #the code below uses islice to read 4 "cells" at a time and combine them
    for (a,b,c,d) in zip(islice(content,0,None,4), islice(content,1,None,4),
                         islice(content,2,None,4), islice(content,3,None,4)):
        sliced_content.append([a,b,c,d])
    title["cells"].append(sliced_content)
To learn more about islice, check out the itertools documentation.
Saving the Data
Downloading the data was the easy part. Cleaning it into 7 dataframes was harder. I unfortunately did have to manually extract each list from the dictionary I made and save it into a data frame. If anyone knows how to transform a cell content into a dataframe name and save the other cells to that dataframe, in a loop for large amounts of data frames, please let me know!
After that, I saved each file to a tab-limited file and started on cleaning the data I had collected. Below is the header for the tab-delimited file for the Gini index:
Conclusion
In this post, I showed how I used BeautifulSoup to web scrape the Country Comparison data from the CIA’s The World Factbook. I am particularly interested in seeing which countries have the best medical care, internet access, education, and economy. In my next post, I will show how exploratory data analysis of this data can help me understand which countries have more high rankings (or in the case of unemployment rate, low rankings).
The complete code and data can be found in my GitHub repo.
Until then, please comment below if you have any suggestions or questions for me. I would especially love to know if you have any questions you’d like answered with the dataset.