
Blog 3b: Exploring data from the CIA's "World Factbook"
How I combined and explored the data of several countries
Where we left off Last Time….
I showed how I used BeautifulSoup to web scrape the Country Comparison data from the CIA’s The World Factbook. I stated I was particularly interested in seeing which countries have the best medical care, internet access, education, and economy, so that I could restrict the number of countries I will research for possibly moving outside the United States. I also stated I would show how to determine which countries had the highest or lowest rankings in the relevant categories.
Cleaning up the Data
The first step to this process was combining my seven dataframe files into one dataframe file so I can see which countries I have information for. I ended up having a total of 235 countries to look through, with 22 columns from the country name and ranks, values, and date of information from the 7 data frames. I was missing information for several countries that appeared on 1 ranking list but not the other 6 ranking lists- the most data I ended up missing in a column was 58, from missing Gini Index information.
Looking at the Data
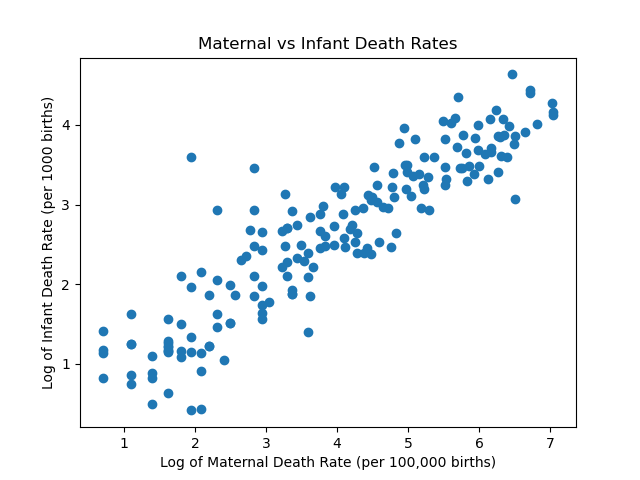
Conclusion
In this post, I showed how cleaned the data frames I collected last into one data frame I could use to explore the data.
The complete code and data can be found in my GitHub repo.
Until then, please comment below if you have any suggestions or questions for me. I would especially love to know if you have any questions you’d like answered via future graphics!